Analytics tab
Path: Vayapin → Settings → Analytics
A read-only dashboard with the key VayaPin metrics for your store, plus the reporting and export controls.
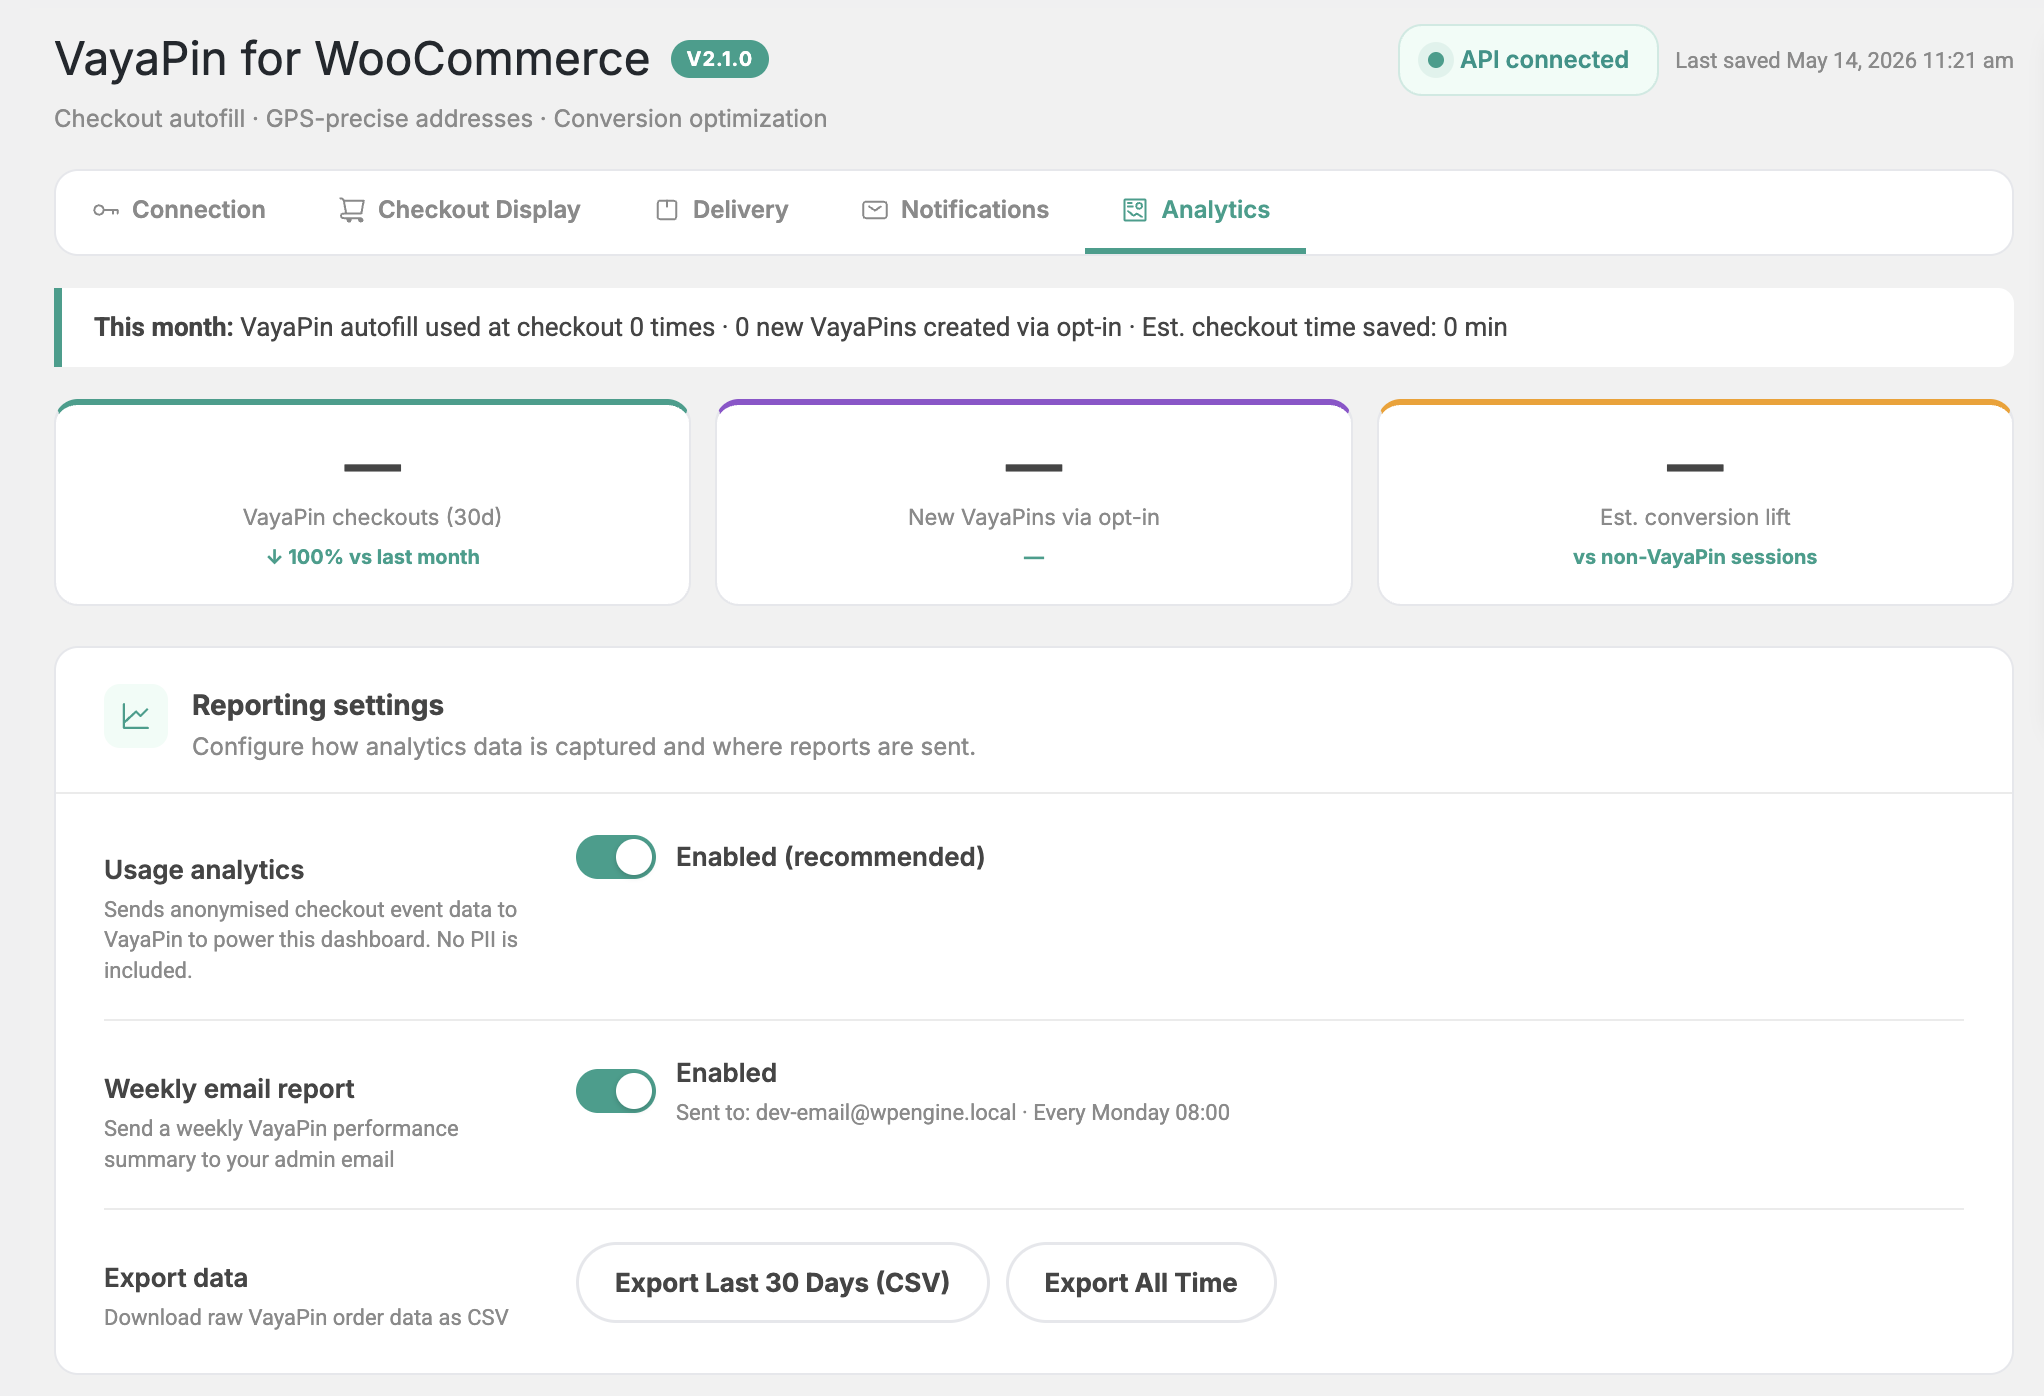
Stat cards (rolling 30 days)
Three headline numbers at the top of the page:
| Card | What it counts |
|---|---|
| VayaPin checkouts (30d) | Orders placed in the last 30 days where a VayaPin code was used to autofill. |
| New VayaPins via opt-in | First-time VayaPins created through your checkout in the last 30 days. |
| Est. conversion lift | Modelled uplift comparing carts that engaged the widget vs. carts that didn't, on the same days. |
The "Est. conversion lift" is a directional estimate, not an experiment. Treat it as a coarse health metric, not a peer-reviewed result.

Reporting settings
Configure how analytics data is captured and where reports are sent.
Usage analytics
Toggle (default Enabled — recommended). Sends anonymised checkout event data to VayaPin to power this dashboard. No PII (name, email, address, phone) is included — only event types, timestamps, and aggregated counters.
If you disable this, the stat cards above keep showing historical data but stop updating.
Weekly email report
Toggle. When Enabled, sends a summary of the previous week to the store admin email every Monday at 08:00 (store timezone). The recipient address is shown next to the toggle.

Export data
Two CSV export buttons:
- Export Last 30 Days (CSV) — events from the rolling 30-day window shown on the stat cards.
- Export All Time — the full event history this store has accumulated. Larger stores may take a few seconds; the export is streamed server-side so there's no row limit.
Exports don't include customer-identifying information — only event types, timestamps, order IDs, and status codes you can correlate against your own WooCommerce data.
